Top

Analysis, Plus Synthesis: Turning Data into Insights

April 27, 2009

Conducting primary user research such as in-depth interviews or field studies can be fairly straightforward, when compared with what you face upon returning to the office with piles of notes, sketches, user journals, and audio and video recordings. You may ask, What should I do with all this data? and How do I turn it into something meaningful?

These are big questions that I cannot answer in just one article, and deciding what kind of documentation or design tool to develop—for example, personas, mental models, user scenarios, or usability test reports—depends on your goals for conducting the research in the first place. But regardless of the output, I believe, for most researchers, the overarching objective is to identify true insights, instead of just reporting facts. Research outputs that we build around a core insight or truth compel design teams to empathize with users, and thus, to design truly meaningful products and services.

In this article, I will outline an approach to gleaning insights from primary qualitative research data. This article is not a how-to for creating the design tools that are often the outputs of primary qualitative user research—such as personas, mental models, or user scenarios. Instead, it identifies an approach to generating overarching insights, regardless of the design tool you want to create.

Champion Advertisement
Continue Reading…

Analysis + Synthesis

Great research involves analysis + synthesis.

Synthesis—“The composition or combination of parts or elements so as to form a whole.”—Webster’s

Too often, as Figure 1 represents, we focus purely on analysis—and the identification of facts—and ignore synthesis, which often occurs organically during analysis. As shown in Figure 2, synthesis involves detective work that lets us see the patterns in our data. Synthesis can present itself as a gut feeling that something is right or true when we examine our data and its patterns. (See Steve Baty’s article “Patterns in User Research” for an excellent overview.)

Figure 1—Analysis of facts, or what we see
Analysis
Figure 2—Synthesis = insight, or what we know
Synthesis

If you conducted the user research, remember this: You spent hours with people asking them questions, listening to them, having conversations, observing behaviors, and empathizing with them. To a certain degree, you know them. If you have a strong feeling about something a participant said or did and can connect that with something another participant said or did, it’s likely you’ve got a budding insight that is worth probing further. Allowing trust-your-gut synthesis can bring forth true insights.

Analysis and synthesis often occur at the same time. We plan and structure our analysis, allowing us to frame the problems, while synthesis is emergent and lets us make connections that identify breakthrough ideas and opportunities, as Figure 3 shows.
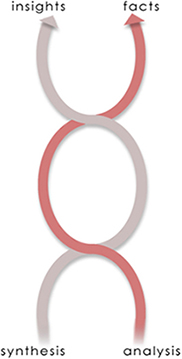
Figure 3—Analysis + synthesis
Analysis + synthesis

If you use the analysis + synthesis approach, you’ll make room for insights to emerge, taking your research beyond pure facts. Still, what do we do with all the data? How do we begin our process of analysis + synthesis? Here are some steps that have worked for me:

  1. Collect and organize the data. Make your data manageable.
  2. Mine the data. Identify what you see.
  3. Sort and cluster the data. Manipulate or reframe your data, as necessary.
  4. Identify insights. Discuss, articulate, incubate, and socialize your insights.

1. Collect and organize the data.

Either just before you set out to conduct your research or very soon after you start, it’s a good idea to set up a system for organizing the many files you’ll collect—including written notes, sketches, digital notes, photos, audio recordings, and video recordings. A system that works for me involves two levels of organization—one, digital; the other, physical.

Digital Organization

Plan to have the content of all audio, video, and hand-written files transcribed in digital format. Create folders for participants, session dates, or another category that works for your team. I have found organizing by participant to be the best approach.

In each folder, include a participant profile document that outlines who the participant is, including any relevant demographic or segmentation data. This profile should provide a quick scan of information about a participant, as a reminder to team members.

At the end of each day or session, store any and all files pertaining to specific participants in their respective folders, including scans or transcripts of hand-written notes, transcripts of audio files, plus the original audio file itself, photos, and video files.

Physical Organization

Designate a war room—a meeting room, a cluster of desks, or common space—to use over the course of your study. There should be a large wall or whiteboard available in this space.

Create your space. Stick your research goals on the wall, put up photos of the sessions, make your space feel like a physical representation of your study.

At the end of each day or session, conduct a team debrief to consolidate notes, talk about key findings, and discuss any interesting points of synthesis. Capture key findings and points of synthesis on large Post-it notes and stick them on a wall. Conduct a discussion about their meaning and importance.
2. Mine the data.

Once you have conducted your research and collected and organized all the data, you can begin to mine your data for facts and findings. This step involves a lot of analysis, or identifying what you see in the data. Here’s a basic process:

  1. Comb through all the files for each participant to identify findings.
  2. Depending on the goals and the desired output for your research, pay attention to key points such as behaviors and attitudes or needs and goals.
  3. Gather useful findings, which can come in the form of user quotations, rephrased points, or facts.
  4. Color-code Post-it notes by participant, type of finding, or whatever system supports your creating the desired output.

Mining the data and visually organizing it in a common physical space lets you more clearly see what’s there and easily reframe it to identify points of synthesis.

3. Sort and cluster the data.

Once you have mined all your research files to identify findings, you can use sorting and clustering techniques to reframe the data. This leads you on a path to creating meaningful outputs and tools from the data, but also allows synthesis to occur.

There are two card-sorting techniques I have used with great success when sorting and clustering data. These techniques are often used with participants during primary research studies to help us understand how users categorize information, as Donna Spencer described in her article “Card Sorting: A Definitive Guide.” I have borrowed these card-sorting techniques and adapted them for use by internal research teams in exercises that let us categorize data for analysis and synthesis. The basic card-sorting techniques are fairly simple:

  • open sorting—Group findings into undefined categories to see what connections emerge.
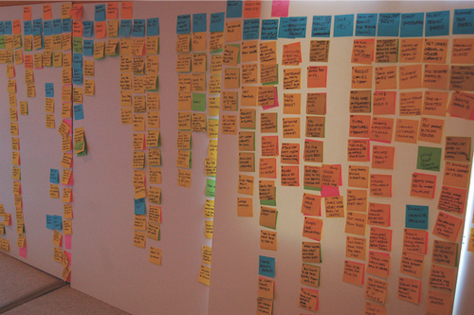
  • closed sorting—Group findings into defined categories to organize data and build upon a determined structure. Your card sort might end up looking like what you see in Figure 4.
Figure 4—An open card sort arrayed on a wall
Card sort

For example, you might have all of your findings for the category Goals and Needs sorted by participant on the wall. Using the closed-sorting technique, you can re-sort them by alikeness to see what goals and needs are duplicated across participants and which are most common and critical. This lets you discover patterns in your data, but what about identifying the true insights in all the patterns?

4. Identify insights.

You have organized your files, mined all the data, represented it visually in a physical space, sorted and re-sorted it. Throughout this process, you have likely found many patterns that give you a gut feeling they are important and even synthesized those patterns into some macro-patterns.

But, how do you take it to the next level and identify insights and core truths about your users from the patterns you’ve found? Follow these steps to identify insights:

  1. Discuss each pattern and point of synthesis as a team. Talk about why you think each is important and what it means. Recall exact quotations from participants, facial expressions, body language, feelings, and attitudes relating to the patterns.
  2. Articulate, in one simple statement, the insight that emerged out of each pattern or point of synthesis. Draft each insight on a Post-it note. But be flexible about changing them when you come back to them later.
  3. Incubate the insights. Leave them for 24 hours, do some other work, remove yourself from the war room. Let them sit with you, undisturbed, for an extended period of time.
  4. Return to and re-articulate the insights with the team. Think of a different way of expressing or articulating them. But if you got them right the first time, don’t change them.
  5. Socialize the insights. Show them to other people who were not involved in the research or analysis + synthesis process. Give them some context, show them the insights, and get their reactions. This will tell you whether the insights resonate. Do people get them? Do they speak to people as the truth? Do the insights compel the design team to create meaningful products and services?

Wrapping Up

Using this analysis + synthesis approach can set you on a path to identifying true, core insights on which to build your research output—instead of just facts. When used together, analysis + synthesis is a powerful approach to getting down to real users’ needs and compelling design teams to create truly useful products and services. 

Senior Design Director at Normative

Toronto, Ontario, Canada

Lindsay EllerbyLindsay started her career as a content analyst before realizing her true calling as an information architect/interaction designer. She has been involved in projects ranging from interaction design for online applications to information design for product pages to the information architecture of marketing Web sites. She has also worked on financial, home renovation, energy and utility, and automobile Web sites. With a particular interest in pattern-based design, Lindsay was instrumental in creating a robust pattern library for Critical Mass. She is an active member of her local UX community, viewing informal gatherings as the best way to share ideas and inspiration.  Read More

Other Articles on User Research

New on UXmatters