I have found that working with a simple Excel spreadsheet gives me everything I need. Knowing just a few tricks makes Excel a versatile tool that meets my needs over the life of a project. Unfortunately, Excel is not a tool most technical communicators learn in school. So, we tend to fall back into our comfort zone, producing documents—with their own overhead of creating templates and styles and writing lots of words that no one seems to read—and working with project planning tools that seem to ask us the hard questions we were hoping they would answer for us. For example, task duration is an input in Microsoft Project, not an output. It’s like having my doctor ask me what I think is wrong with me.
The Information Model
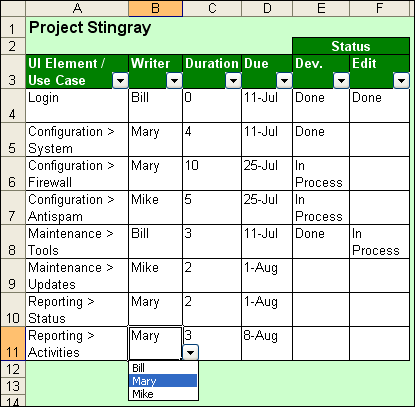
In discussing this different approach to project management, let’s start at the end, with an information model that shows what work we need to do, who to assign the different task components to, when the components are due, and what the current status of each component is. Figure 1 shows an example of an information model for a simple Help project. On this project, multiple writers are working separately on their own topics, and the manager wants all topics to go through editing before including the Help in the Quality Assurance build. To avoid creating a bottleneck at the end of the project, the manager wants the editing to keep pace with the information development.

On real projects I’ve helped manage, the actual tables I’ve created have had more rows to accommodate more components than this example shows, but otherwise, this is a realistic example.
Next, I’ll discuss how to use this information model. Then, I’ll show you how to build one.
The first column is an inventory of stuff we need to document. I have found two useful organizational structures for Help projects. The one shown in Figure 1 lists the basic components of the user interface (UI) itself and even identifies them by their navigational paths in the product. Another approach is to organize the work around use cases—a useful approach if you must do your planning before the UI design exists.
The second column is for assigning writers. Instead of free-form text entry, it uses a drop-down list that includes the names of the writers on the team. (I’ll show you how to create these drop-down lists later.) The use of lists for data entry is important if you want to be able to filter consistently, as we’ll soon see.
The third column is an estimate of how long it will take to document a component. Later, I’ll show how Excel can help you come up with that number.
The fourth column is the due date, which the writer provides, basing it on the estimated durations. The last two columns are status columns—once again with data coming from a predefined drop-down list.
The power of this information model comes from its ability to let you filter by multiple columns. And, in this day of modular writing projects, it lets you track the status of components across a broad writing team.
Scenarios for Using This Information Model
Let’s review a couple of scenarios that show different ways team members could use this information model.
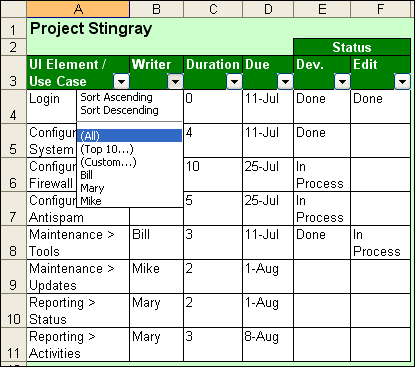
Scenario 1—Mary wants to see what components she is responsible for. (Granted, in this example, that’s not too hard, but a real project would have a much longer inventory.) As shown in Figure 2, she merely has to click the arrow in the Writer column header to display a drop-down list and select her name to filter the list of components, displaying only those assigned to her. (The drop-down list lets her filter the list of components in several different ways.)

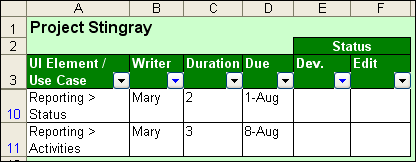
Once Mary has selected her name and the list is filtered to show just her assigned topics, she can further filter the list by selecting Blanks in the Dev. drop-down list under Status. She now sees just her own assignments that she has neither started nor completed, as shown in Figure 3.

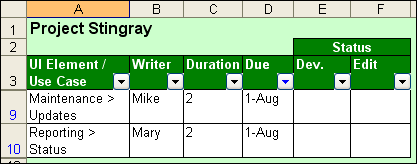
Scenario 2—Mary’s boss wants to follow up on how the writers are doing, so she filters the list to see what topics are due on August 1st, the upcoming Friday, in the Due Date column.
Tip—Enter all due dates using a consistent day of the week such as Friday.
Mary’s manager look at the view shown in Figure 4, then walks by Mike’s and Mary’s cubes to ask them how the Updates and Status topics are coming, respectively, and whether they’ll finish them this week.


